House prices in Weidackerstrasse, 9245 Oberbüren
The average property price in Weidackerstrasse, 9245 Oberbüren is CHF 9’051 per m² in October 2026.
Street
CHF 9’051
CHF 7’846 - CHF 9’407
Price per m² in Weidackerstrasse, 9245 Oberbüren as of October 2026
Evolution of Real Estate Prices and Market Trends in 9245 Oberbüren
Over the past 12 months, house prices have increased by +2.3%, while apartment prices have risen by +3.5%. The chart below illustrates the evolution of property prices in 9245 Oberbüren over the past 25 years.
Over a period of 25 years, the price per square meter has recorded an increase of +88% for houses and a rise of +96.1% for apartments, thus illustrating the housing market trends over time.
3 months
+0.9%
6 months
+1.9%
1 year
+3.5%
5 years
+16.8%
10 years
+38.5%
20 years
+85.3%
25 years
-
Max
+96.1%
Best real estate agencies near Weidackerstrasse

delucaimmo GmbH
(18 reviews)
1transaction near Weidackerstrasse
31transactions in Switzerland

Büchler AG Immobilien-Dienstleistungen
(8 reviews)
2transactions in Oberbüren
82transactions in Switzerland

zurimo RE GmbH
(55 reviews)
1transaction in Oberbüren
23transactions in Switzerland

SZ Immo
(97 reviews)
1transaction in Oberbüren
81transactions in Switzerland

Montandon Immobilien GmbH
(14 reviews)
1transaction in Oberbüren
38transactions in Switzerland
Recent transactions near Weidackerstrasse in 9245 Oberbüren
Discover recent transactions near Weidackerstrasse in 9245 Oberbüren, including sold house prices.
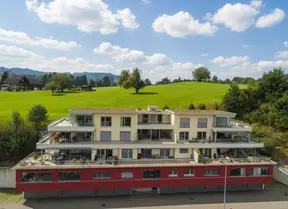 SOLDJul 2026
Attic flat • 3.5 rooms
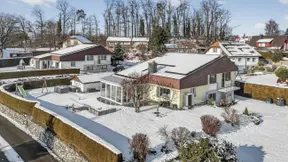 SOLDMay 2026
Single house • 7.5 rooms

House prices in Weidackerstrasse, 9245 Oberbüren
Use artificial intelligence to get an instant valuation of your property
Appraise my home for freeAverage prices in 9245 Oberbüren
House prices
The median price for a house on the market is CHF 1’100’477. The selling price for 80% of properties falls between CHF 557’776 and CHF 2’211’005. The average price per m² in 9245 Oberbüren for a house is CHF 7’337 / m² (price per square meter).
| Property type | Average price | |
|---|---|---|
| House: 4 rms. | House: 4 rms. | CHF 1.4M |
| House: 5 rms. | House: 5 rms. | CHF 1.4M |
| House: 6 rms. | House: 6 rms. | CHF 1.4M |
| House: 7 rms. | House: 7 rms. | CHF 1.5M |
| House: 8 rms. | House: 8 rms. | CHF 1.6M |
Price Range (CHF)
Apartment prices
The median price for an apartment on the market is CHF 783’292. The selling price for 80% of properties falls between CHF 445’296 and CHF 1’384’174. The average price per m² in 9245 Oberbüren for an apartment is CHF 6’420 / m² (price per square meter).
| Property type | Average price | |
|---|---|---|
| Studio | Studio | CHF 701k |
| Apt: 2 rms. | Apartment: 2 rms. | CHF 712k |
| Apt: 3 rms. | Apartment: 3 rms. | CHF 772k |
| Apt: 4 rms. | Apartment: 4 rms. | CHF 919k |
| Apt: 5 rms. | Apartment: 5 rms. | CHF 1.2M |
Price Range (CHF)
Average monthly rents in 9245 Oberbüren
Monthly rent for houses
The median monthly rent for a house is CHF 2’664. The rent for 80% of properties falls between CHF 1’350 and CHF 5’352. The average yearly rent per m² in 9245 Oberbüren for a house is CHF 213 / m² (price per square meter).
| Property type | Average rent | |
|---|---|---|
| House: 4 rms. | House: 4 rms. | CHF 2’353 |
| House: 5 rms. | House: 5 rms. | CHF 2’420 |
| House: 6 rms. | House: 6 rms. | CHF 2’697 |
| House: 7 rms. | House: 7 rms. | CHF 3’153 |
| House: 8 rms. | House: 8 rms. | CHF 3’497 |
Monthly Rent Range (CHF)
Monthly rent for apartments
The median monthly rent for an apartment is CHF 2’636. The rent for 80% of properties falls between CHF 1’498 and CHF 4’658. The average yearly rent per m² in 9245 Oberbüren for an apartment is CHF 259 / m² (price per square meter).
| Property type | Average rent | |
|---|---|---|
| Studio | Studio | CHF 682 |
| Apt: 2 rms. | Apartment: 2 rms. | CHF 1’358 |
| Apt: 3 rms. | Apartment: 3 rms. | CHF 1’779 |
| Apt: 4 rms. | Apartment: 4 rms. | CHF 2’070 |
| Apt: 5 rms. | Apartment: 5 rms. | CHF 2’267 |
Monthly Rent Range (CHF)


