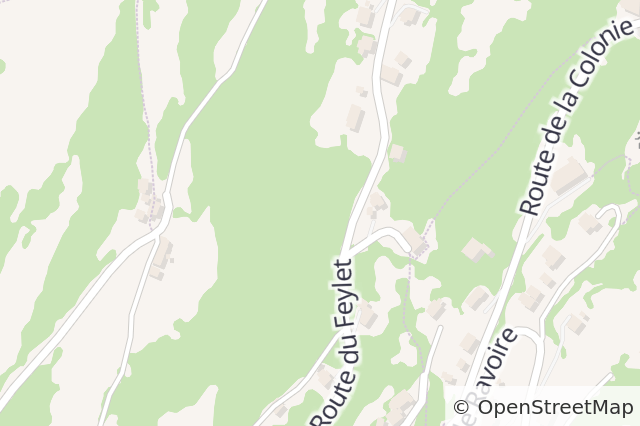
House prices in Martigny-Combe
The average property price in Martigny-Combe is CHF 5’570 per m² in September 2026.
Price per m²
Rent per m²
Model based on listings, historical sales, professional appraisals, and Swiss geospatial data (SwissTLM3D, Opendata.swiss, SRED, OpenStreetMap), verified and updated monthly – see our full price calculation methodology.
Apartments
CHF 5’523
CHF 2’741 - CHF 14’111
Houses
CHF 5’707
CHF 2’885 - CHF 12’760
Apartments
CHF 260
CHF 129 - CHF 665
Houses
CHF 228
CHF 115 - CHF 510
Median price per m² as – September 2026 - How are our prices calculated?
Average annual rent per m² - September 2026 - How are our prices calculated?
Evolution of Real Estate Prices and Market Trends in Martigny-Combe
Over the past 12 months, house prices have increased by +3%, while apartment prices have risen by +4.2%. The chart below illustrates the evolution of property prices in Martigny-Combe over the past 25 years.
Over a period of 25 years, the price per square meter has recorded an increase of +108.9% for houses and a rise of +120.3% for apartments, thus illustrating the housing market trends over time.
Apartments
Houses
3 months
+1.3%
6 months
+2.8%
1 year
+4.2%
5 years
+18.4%
10 years
+28.7%
20 years
+81.5%
25 years
-
Max
+120.3%
Best real estate agencies: Martigny-Combe
Agencies
Agents
Laura Immo
5transactions in Martigny-Combe
9transactions in Switzerland

Valimmobilier SA - Champex-Lac
(1 review)
3transactions in Martigny-Combe
25transactions in Switzerland
Progestimmo Sàrl
(116 reviews)
2transactions in Martigny-Combe
174transactions in Switzerland

Valimmobilier SA - Martigny
(36 reviews)
2transactions in Martigny-Combe
50transactions in Switzerland

VAL Group SA - Sion
(90 reviews)
2transactions in Martigny-Combe
101transactions in Switzerland
Recent transactions in Martigny-Combe
Discover recent transactions in Martigny-Combe, including sold house prices.
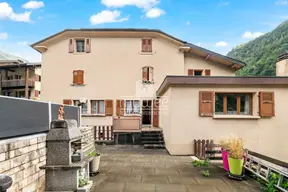
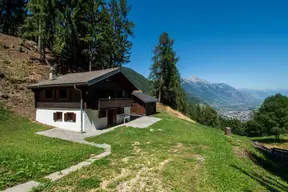 SOLDOct 2026
Chalet • 3.5 rooms
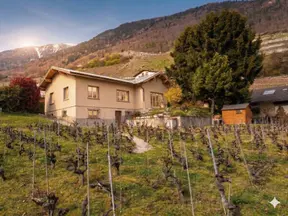
 SOLDMar 2026
Chalet • 5 rooms
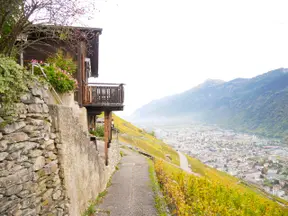
 SOLDMar 2026
Single house • 11 rooms
House prices in Martigny-Combe
Use artificial intelligence to get an instant valuation of your property
Appraise my home for freeProperty prices by street in Martigny-Combe
| Sur le Mont | CHF 7’200 |
| Route des Rappes | CHF 6’713 |
| Route du Sommet-des-Vignes | CHF 6’555 |
| Chez Dorin | CHF 6’445 |
| Rue du Grand Pré | CHF 6’143 |
| Route de la Fontaine | CHF 6’096 |
| Route de Plan-Cerisier | CHF 6’001 |
| Route des Creusats | CHF 5’904 |
| Route des Bans | CHF 5’879 |
Average prices in Martigny-Combe
House prices
The median price for a house on the market is CHF 855’981. The selling price for 80% of properties falls between CHF 432’800 and CHF 1’913’936. The average price per m² in Martigny-Combe for a house is CHF 5’707 / m² (price per square meter).
| Property type | Average price | |
|---|---|---|
| House: 4 rms. | House: 4 rms. | CHF 706k |
| House: 5 rms. | House: 5 rms. | CHF 868k |
| House: 6 rms. | House: 6 rms. | CHF 994k |
| House: 7 rms. | House: 7 rms. | CHF 1.1M |
| House: 8 rms. | House: 8 rms. | CHF 1.4M |
Price Range (CHF)
Apartment prices
The median price for an apartment on the market is CHF 494’278. The selling price for 80% of properties falls between CHF 245’322 and CHF 1’262’954. The average price per m² in Martigny-Combe for an apartment is CHF 5’523 / m² (price per square meter).
| Property type | Average price | |
|---|---|---|
| Studio | Studio | CHF 60k |
| Apt: 2 rms. | Apartment: 2 rms. | CHF 170k |
| Apt: 3 rms. | Apartment: 3 rms. | CHF 331k |
| Apt: 4 rms. | Apartment: 4 rms. | CHF 572k |
| Apt: 5 rms. | Apartment: 5 rms. | CHF 908k |
Price Range (CHF)
Average monthly rents in Martigny-Combe
Monthly rent for houses
The median monthly rent for a house is CHF 2’852. The rent for 80% of properties falls between CHF 1’442 and CHF 6’377. The average yearly rent per m² in Martigny-Combe for a house is CHF 228 / m² (price per square meter).
| Property type | Average rent | |
|---|---|---|
| House: 4 rms. | House: 4 rms. | CHF 1’832 |
| House: 5 rms. | House: 5 rms. | CHF 2’462 |
| House: 6 rms. | House: 6 rms. | CHF 4’036 |
| House: 7 rms. | House: 7 rms. | CHF 9’842 |
| House: 8 rms. | House: 8 rms. | CHF 27k |
Monthly Rent Range (CHF)
Monthly rent for apartments
The median monthly rent for an apartment is CHF 1’942. The rent for 80% of properties falls between CHF 964 and CHF 4’963. The average yearly rent per m² in Martigny-Combe for an apartment is CHF 260 / m² (price per square meter).
| Property type | Average rent | |
|---|---|---|
| Studio | Studio | CHF 737 |
| Apt: 2 rms. | Apartment: 2 rms. | CHF 1’143 |
| Apt: 3 rms. | Apartment: 3 rms. | CHF 1’532 |
| Apt: 4 rms. | Apartment: 4 rms. | CHF 1’923 |
| Apt: 5 rms. | Apartment: 5 rms. | CHF 2’275 |
Monthly Rent Range (CHF)
For sale in Martigny-Combe
For rent in Martigny-Combe
Price per sqm per locality in Martigny-Combe
| CHF 5’414 | CHF 5’796 | - | |
| CHF 5’653 | CHF 5’575 | - |