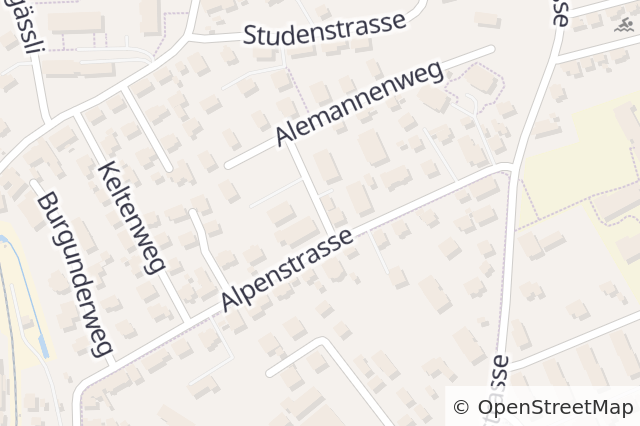
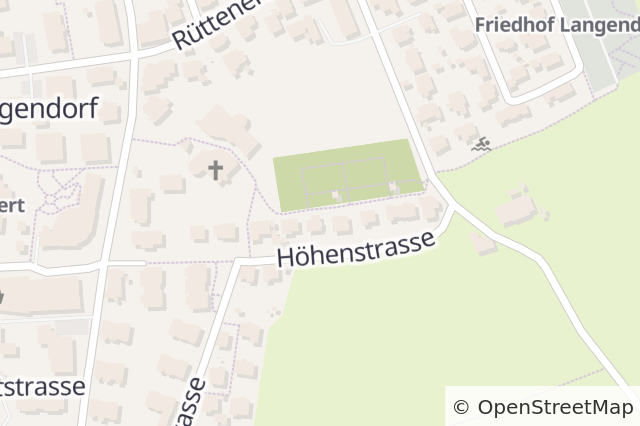
House prices in District of Lebern
Evolution of Real Estate Prices and Market Trends in District of Lebern
Over the past 12 months, house prices have increased by +3.2%, while apartment prices have risen by +4.4%. The chart below illustrates the evolution of property prices in District of Lebern over the past 25 years.
Over a period of 25 years, the price per square meter has recorded an increase of +78.2% for houses and a rise of +73.4% for apartments, thus illustrating the housing market trends over time.
3 months
+0.9%
6 months
+2.4%
1 year
+4.4%
5 years
+17.4%
10 years
+35.3%
20 years
+62%
25 years
-
Max
+73.4%
Best real estate agencies: District of Lebern
Kocher Immobilien AG - Standort Solothurn
(67 reviews)
17transactions in District of Lebern
57transactions in Switzerland
A. Früh Immobilien Schweiz AG
(155 reviews)
14transactions in District of Lebern
33transactions in Switzerland

Trivora Immobilien AG
7transactions in District of Lebern
10transactions in Switzerland

Follow Immobilien GmbH - Solothurn
6transactions in District of Lebern
14transactions in Switzerland

Immo Link Schweiz
(12 reviews)
4transactions in District of Lebern
12transactions in Switzerland
House prices in District of Lebern
Use artificial intelligence to get an instant valuation of your property
Appraise my home for freeAverage prices in District of Lebern
House prices
The median price for a house on the market is CHF 0. The selling price for 80% of properties falls between CHF 0 and CHF 0. The average price per m² in District of Lebern for a house is CHF 0 / m² (price per square meter).
| Property type | Average price | |
|---|---|---|
| House: 4 rms. | House: 4 rms. | Not available |
| House: 5 rms. | House: 5 rms. | Not available |
| House: 6 rms. | House: 6 rms. | Not available |
| House: 7 rms. | House: 7 rms. | Not available |
| House: 8 rms. | House: 8 rms. | Not available |
Apartment prices
The median price for an apartment on the market is CHF 0. The selling price for 80% of properties falls between CHF 0 and CHF 0. The average price per m² in District of Lebern for an apartment is CHF 0 / m² (price per square meter).
| Property type | Average price | |
|---|---|---|
| Studio | Studio | Not available |
| Apt: 2 rms. | Apartment: 2 rms. | Not available |
| Apt: 3 rms. | Apartment: 3 rms. | Not available |
| Apt: 4 rms. | Apartment: 4 rms. | Not available |
| Apt: 5 rms. | Apartment: 5 rms. | Not available |
Average monthly rents in District of Lebern
Monthly rent for houses
The median monthly rent for a house is CHF 0. The rent for 80% of properties falls between CHF 0 and CHF 0. The average yearly rent per m² in District of Lebern for a house is CHF 0 / m² (price per square meter).
| Property type | Average rent | |
|---|---|---|
| House: 4 rms. | House: 4 rms. | Not available |
| House: 5 rms. | House: 5 rms. | Not available |
| House: 6 rms. | House: 6 rms. | Not available |
| House: 7 rms. | House: 7 rms. | Not available |
| House: 8 rms. | House: 8 rms. | Not available |
Monthly rent for apartments
The median monthly rent for an apartment is CHF 0. The rent for 80% of properties falls between CHF 0 and CHF 0. The average yearly rent per m² in District of Lebern for an apartment is CHF 0 / m² (price per square meter).
| Property type | Average rent | |
|---|---|---|
| Studio | Studio | Not available |
| Apt: 2 rms. | Apartment: 2 rms. | Not available |
| Apt: 3 rms. | Apartment: 3 rms. | Not available |
| Apt: 4 rms. | Apartment: 4 rms. | Not available |
| Apt: 5 rms. | Apartment: 5 rms. | Not available |