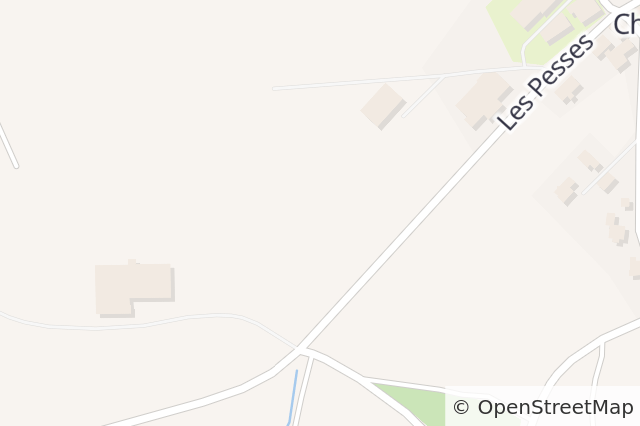
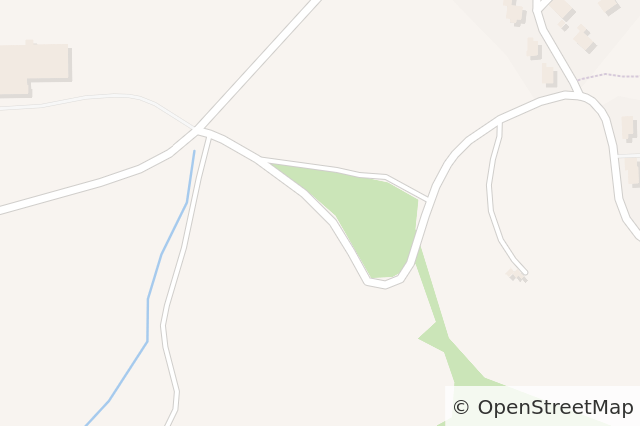
House prices in Champoz (2735)
The average property price in Champoz (2735) is CHF 4’353 per m² in October 2026.
Model based on listings, historical sales, professional appraisals, and Swiss geospatial data (SwissTLM3D, Opendata.swiss, SRED, OpenStreetMap), verified and updated monthly – see our full price calculation methodology.
Apartments
CHF 4’289
CHF 2’246 - CHF 7’885
Houses
CHF 4’475
CHF 2’488 - CHF 9’041
Apartments
CHF 187
CHF 98 - CHF 343
Houses
CHF 168
CHF 93 - CHF 339
Median price per m² as – October 2026 - How are our prices calculated?
Average annual rent per m² - October 2026 - How are our prices calculated?
Evolution of Real Estate Prices and Market Trends in Champoz (2735)
Over the past 12 months, house prices have increased by +2.8%, while apartment prices have risen by +4.4%. The chart below illustrates the evolution of property prices in Champoz (2735) over the past 25 years.
Over a period of 25 years, the price per square meter has recorded an increase of +66.2% for houses and a rise of +71.3% for apartments, thus illustrating the housing market trends over time.
3 months
+1%
6 months
+2.4%
1 year
+4.4%
5 years
+15.8%
10 years
+28.3%
20 years
+61.3%
25 years
-
Max
+71.3%
Best real estate agencies: Champoz (2735)


Laetitia Jaumotte
(16 reviews)
16transactions in District of Jura bernois
16transactions in Switzerland


Béatrice Tobler
8transactions in District of Jura bernois
21transactions in Switzerland

Sadry Ben Brahim
(6 reviews)
8transactions in District of Jura bernois
21transactions in Switzerland

Julien Bichsel
(4 reviews)
6transactions in District of Jura bernois
9transactions in Switzerland

Julien Gogniat
(8 reviews)
5transactions in District of Jura bernois
8transactions in Switzerland
House prices in Champoz (2735)
Use artificial intelligence to get an instant valuation of your property
Appraise my home for freeAverage prices in Champoz (2735)
House prices
The median price for a house on the market is CHF 702’516. The selling price for 80% of properties falls between CHF 390’685 and CHF 1’419’368. The average price per m² in Champoz (2735) for a house is CHF 4’475 / m² (price per square meter).
| Property type | Average price | |
|---|---|---|
| House: 4 rms. | House: 4 rms. | CHF 905k |
| House: 5 rms. | House: 5 rms. | CHF 1M |
| House: 6 rms. | House: 6 rms. | CHF 1.2M |
| House: 7 rms. | House: 7 rms. | CHF 1.3M |
| House: 8 rms. | House: 8 rms. | CHF 1.3M |
Price Range (CHF)
Apartment prices
The median price for an apartment on the market is CHF 446’100. The selling price for 80% of properties falls between CHF 233’547 and CHF 820’037. The average price per m² in Champoz (2735) for an apartment is CHF 4’289 / m² (price per square meter).
| Property type | Average price | |
|---|---|---|
| Studio | Studio | CHF 523k |
| Apt: 2 rms. | Apartment: 2 rms. | CHF 574k |
| Apt: 3 rms. | Apartment: 3 rms. | CHF 674k |
| Apt: 4 rms. | Apartment: 4 rms. | CHF 807k |
| Apt: 5 rms. | Apartment: 5 rms. | CHF 991k |
Price Range (CHF)
Average monthly rents in Champoz (2735)
Monthly rent for houses
The median monthly rent for a house is CHF 2’194. The rent for 80% of properties falls between CHF 1’220 and CHF 4’434. The average yearly rent per m² in Champoz (2735) for a house is CHF 168 / m² (price per square meter).
| Property type | Average rent | |
|---|---|---|
| House: 4 rms. | House: 4 rms. | CHF 2’449 |
| House: 5 rms. | House: 5 rms. | CHF 2’766 |
| House: 6 rms. | House: 6 rms. | CHF 3’092 |
| House: 7 rms. | House: 7 rms. | CHF 3’518 |
| House: 8 rms. | House: 8 rms. | CHF 4’137 |
Monthly Rent Range (CHF)
Monthly rent for apartments
The median monthly rent for an apartment is CHF 1’618. The rent for 80% of properties falls between CHF 847 and CHF 2’974. The average yearly rent per m² in Champoz (2735) for an apartment is CHF 187 / m² (price per square meter).
| Property type | Average rent | |
|---|---|---|
| Studio | Studio | CHF 883 |
| Apt: 2 rms. | Apartment: 2 rms. | CHF 1’344 |
| Apt: 3 rms. | Apartment: 3 rms. | CHF 1’664 |
| Apt: 4 rms. | Apartment: 4 rms. | CHF 1’970 |
| Apt: 5 rms. | Apartment: 5 rms. | CHF 2’362 |
Monthly Rent Range (CHF)